
Loading…
Loading…


See exactly how XRT's revenue becomes profit — a Sankey that traces revenue (and its reported segments) through gross profit, operating expenses, and net profit, with the year-over-year change on every line.
The same diagram the Chart Builder draws, right on the Summary tab. Upgrade to unlock it for XRT and 80,000+ other tickers.
The State Street SPDR S&P Retail ETF (XRT) is designed to replicate, before fees and expenses, the overall investment performance of the S&P Retail Select Industry Index. This fund offers investors focused access to the comprehensive retail segment of the S&P Total Market Index (TMI). It covers a broad spectrum of retail activities, including, but not limited to, Apparel, Automotive, Broadline, Computer & Electronic, Consumer Staples Merchandise, Drug, Food, and Other Specialty Retailers. The ETF achieves its objective by tracking an index that employs a modified equal-weighting methodology…

Designed to provide broad exposure to the Consumer Discretionary - Retail segment of the equity market, the State Street SPDR S&P Retail ETF (XRT) is a passively managed exchange traded fund launched on June 19, 2006.

Brent crude nears $100 as escalating U.S.-Iran tensions raise supply risks, putting oil and energy ETFs in focus while pressuring retail, airline and India-focused funds.

SPDR S&P Retail ETF (NYSEARCA:XRT - Get Free Report) was the target of some unusual options trading activity on Tuesday. Stock traders acquired 34,121 put options on the stock. This represents an increase of approximately 145% compared to the typical volume of 13,932 put options. SPDR S&P Retail ETF Trading Down 2.2% Shares of NYSEARCA:XRT

We're more than halfway through 2026, and retail leaders are confronting a familiar challenge with new urgency: how do you keep moving forward amid persistent uncertainty while proving that investments in AI are delivering real business value?
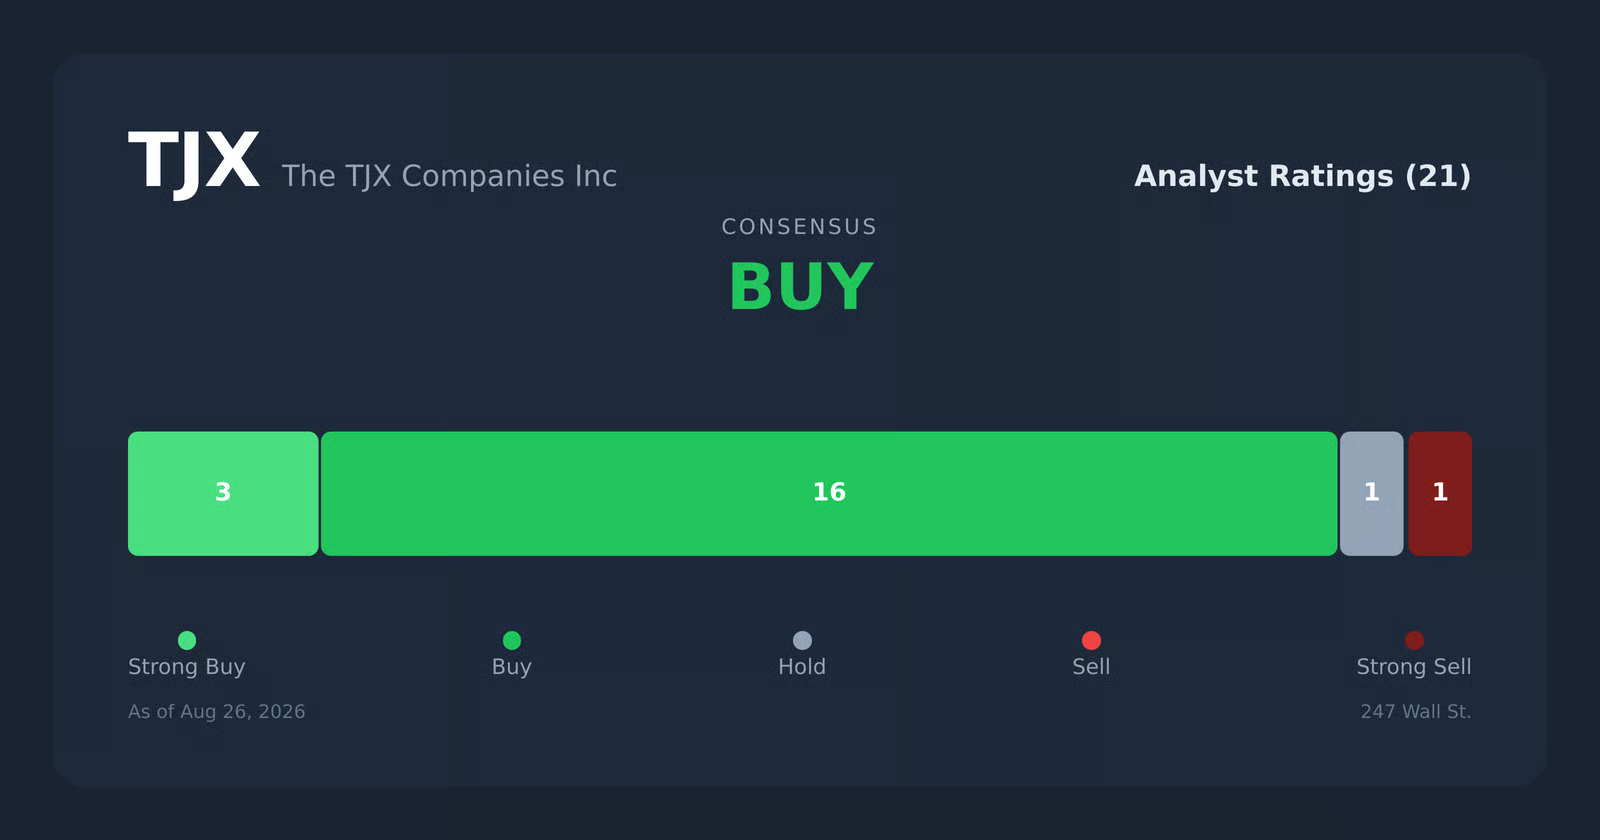
TJX beat estimates, raised guidance, and expanded margins, yet the stock shed 11% in a month while its closest rival surged 34% year to date. The split between what the business delivered and what investors did next tells a complicated story about where the risk actually sits.