
Loading…
Loading…

MWH (SOLV Energy, Inc. Class A Common Stock) is a recent IPO.
It began trading on February 11, 2026, giving it less than a year of public history. Many charts and metrics below are sparse or empty until more price, financial, and analyst history accumulates. The affected sections are flagged individually so you can tell limited history from missing data.


SAN DIEGO, Oct. 22, 2026 (GLOBE NEWSWIRE) -- SOLV Energy, Inc. (“SOLV” or the “Company”) (Nasdaq: MWH) plans to report third quarter 2026 results on Thursday, November 12, 2026. Management will present results during a conference call at 8:30 a.m. Eastern time.
JFB Construction (NASDAQ: JFB - Get Free Report) and SOLV Energy (NASDAQ: MWH - Get Free Report) are both industrials companies, but which is the better business? We will compare the two businesses based on the strength of their earnings, analyst recommendations, dividends, institutional ownership, valuation, profitability and risk. Profitability This table compares JFB Construction and SOLV
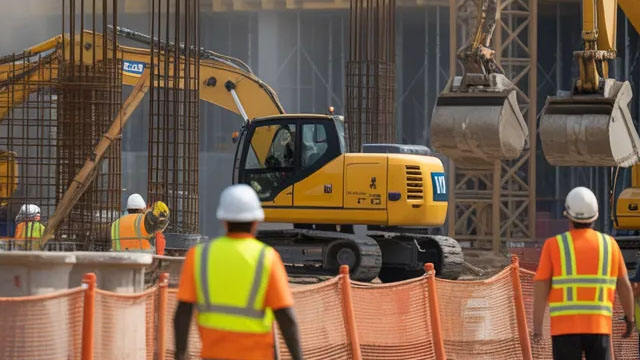
Solv Energy, Inc. is capitalizing on robust data center-driven demand, with an $8.9B backlog and projected 58% FY26 growth. MWH trades at 14.7x FY27E non-GAAP EPS and 10.6x EV/FY26E Adj. EBITDA, with valuation compressed by private equity overhang. Management raised FY26 guidance after strong 2Q26 results, highlighting a shift to higher-margin O&M revenue and expanding EPC backlog.

SOLV Energy NASDAQ: MWH reported record first-half results for 2026, citing increased new-construction activity, project execution and contributions from prior acquisitions. The company also raised its full-year revenue and adjusted EBITDA outlook while reporting a 44% year-over-year increase in backlog.

SOLV Energy, Inc. (MWH) Q2 2026 Earnings Call Transcript

SAN DIEGO, Aug. 13, 2026 (GLOBE NEWSWIRE) -- SOLV Energy, Inc. (“SOLV” or the “Company”) (Nasdaq: MWH), a leading provider of infrastructure services to the power industry, today announced financial results for the second quarter ended June 30, 2026. Financial Summary (in $ millions except percentages) Three Months Ended June 30, Six Months Ended June 30, 2026 2025 2026 2025 Revenue 951 536 1,628 944 Gross Profit 1 140 113 259 172 Gross Margin 1 14.7% 21.1% 15.9% 18.2% Net Income 2 67 45 39 44 Adjusted Gross Profit 3 145 113 269 172 Adjusted Gross Margin 3 15.2% 21.1% 16.5% 18.2% Adjusted EBITDA 117 86 210 120 Adjusted EBITDA Margin 12.4% 16.1% 12.9% 12.7% 1) Beginning with the second quarter of 2026, the Company classified certain annual incentive compensation within Cost of Revenue instead of Selling, general & administrative expense.
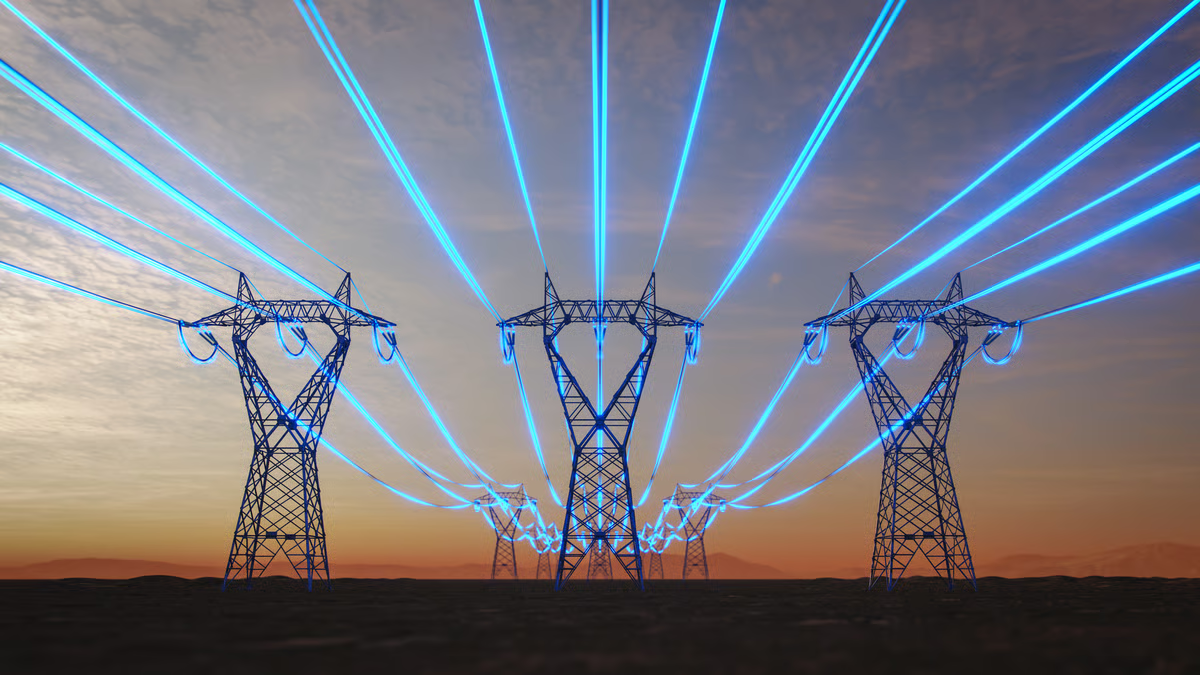
AI's power boom is reshaping the energy market, and these are some companies investors should watch.