
Loading…
Loading…

DUKB is a hybrid capital security, not common stock.
This listing is a capital note, preference share, or similar instrument associated with Duke Energy Corporation 5.625%. Data providers report company-level figures against it, so fundamentals, valuation multiples, and dividend history on this page describe the issuing company — not this instrument — and its market capitalization cannot be computed reliably, so it is not shown. The quoted price is the instrument's own.

Sell-side consensus EPS, revenue estimates, YoY growth, forward P/E, and per-year analyst coverage — for any covered stock.
Click below to see what's inside, then upgrade to unlock for this and 80,000+ other tickers.
A year-by-year projected price path from the sell-side EPS consensus, with an editable target P/E and the implied annual return from today's price.
Click below to see what's inside, then upgrade to unlock for DUKB and 80,000+ other tickers.
See price against where its own fundamentals say it should trade — the shaded gap is the discount or premium, across five valuation lenses.
Click below to see what's inside, then upgrade to unlock for DUKB and 80,000+ other tickers.
See exactly how DUKB's revenue becomes profit — a Sankey that traces revenue (and its reported segments) through gross profit, operating expenses, and net profit, with the year-over-year change on every line.
The same diagram the Chart Builder draws, right on the Summary tab. Upgrade to unlock it for DUKB and 80,000+ other tickers.
Duke Energy Corporation is a major provider of natural gas distribution and a range of energy-related services. Its operations are organized into three distinct divisions: Electric Utilities and Infrastructure, Gas Utilities and Infrastructure, and a segment designated as "Other." The Electric Utilities and Infrastructure division manages regulated electricity supply across regions including the Carolinas, Florida, and the Midwest. In contrast, the Gas Utilities and Infrastructure division encompasses entities like Piedmont, local natural gas distribution companies operating in Ohio and…

A weekly summary of dividend activity for Dividend Champions and Contenders. Companies which changed their dividends.

Growth has massively outpaced value for nearly the last decade. This trend may well continue into the future, but its definitely not a straight line.
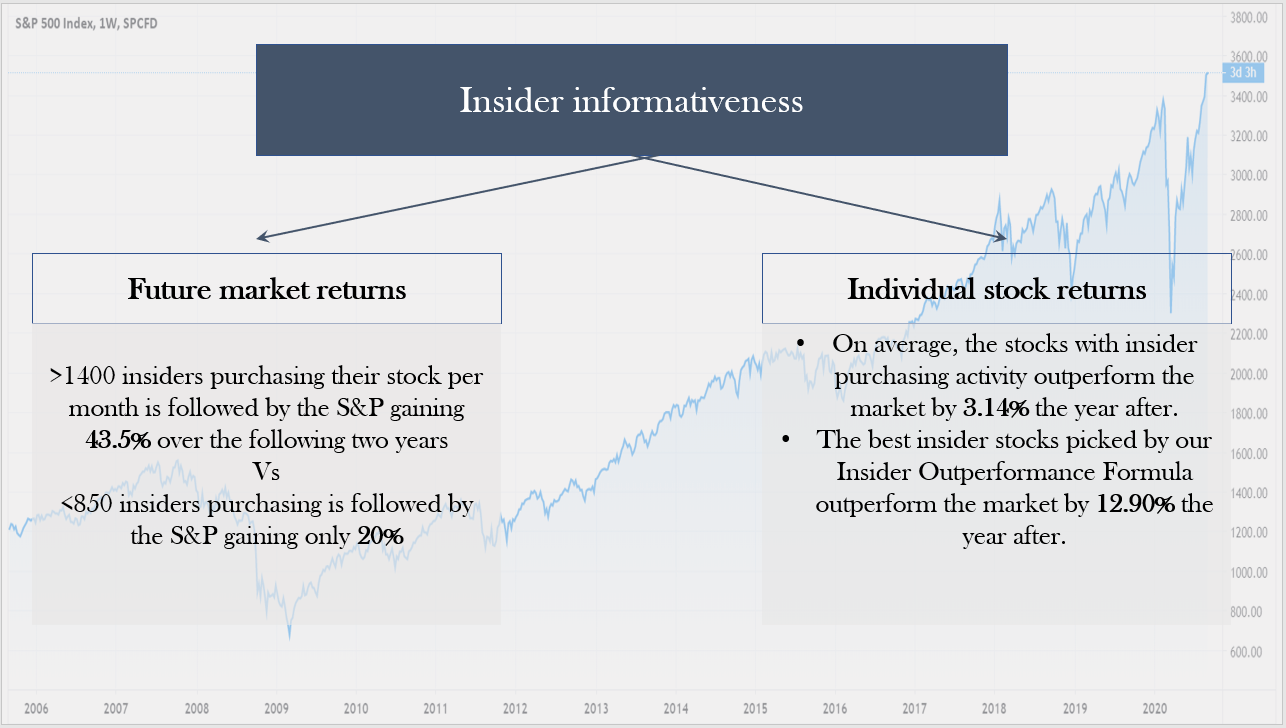
Insider activity is very informative to follow up for two reasons: it can help predict future market movements and it can be interesting to find undervalued stocks.
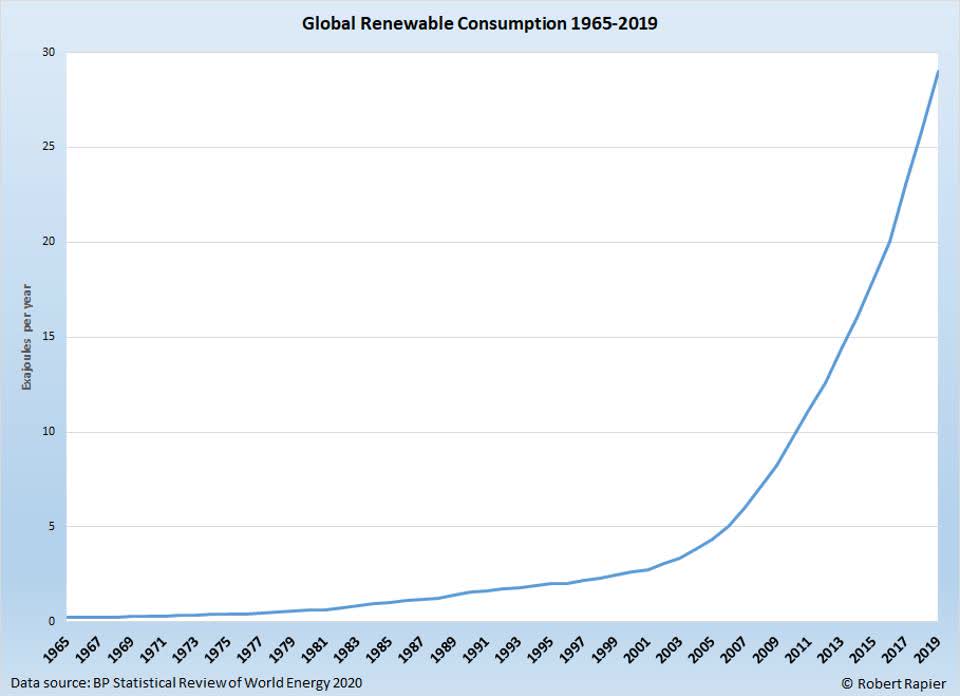
The world is changing right before our eyes. Twenty years ago, renewable energy sources like wind and solar were expensive, inefficient, and generally avoided by the for-profit sector.

John's retirement accounts generated a total of $1,568.09 of dividend income for July 2020 vs. $1912.99 of dividend income for July of 2019.