
Loading…
Loading…


The Vanguard 0-3 Month Treasury Bill ETF (VBIL) aims to replicate the performance of a market-value-weighted Treasury index characterized by a very short dollar-weighted average maturity. This passively managed fund specifically targets the Bloomberg US Treasury Bills 0-3 Months Index. This benchmark consists of U.S. Treasury Bills that mature within three months, deliberately excluding inflation-protected bonds, floating rate securities, and certain other types of debt. Rather than holding every component, VBIL employs a sampling approach, investing in a selection of securities designed to…
Is VBIL's expense ratio expensive, average, or a steal for its category?
Pro reveals the verdict on a 5-tier spectrum calibrated against ICI 2025 industry averages, with strategy-aware bands so the comparison is meaningful.

The yield on the 10-year note finished August 28, 2026 at 4.73% while the 2-year note ended at 4.34%. The chart below overlays the daily performance of several Treasury bonds, starting from the pre-recession equity market peaks, along with the Federal Funds Rate (FFR) since 2007.
The yield on the 10-year note finished August 14, 2026 at 4.68% while the 2-year note ended at 4.17%. The chart below overlays the daily performance of several Treasury bonds, starting from the pre-recession equity market peaks, along with the Federal Funds Rate (FFR) since 2007.
Apella Capital LLC reduced its position in Vanguard 0-3 Month Treasury Bill ETF (NASDAQ: VBIL) by 9.4% in the undefined quarter, according to its most recent Form 13F filing with the Securities and Exchange Commission (SEC). The institutional investor owned 411,969 shares of the company's stock after selling 42,632 shares during the quarter.
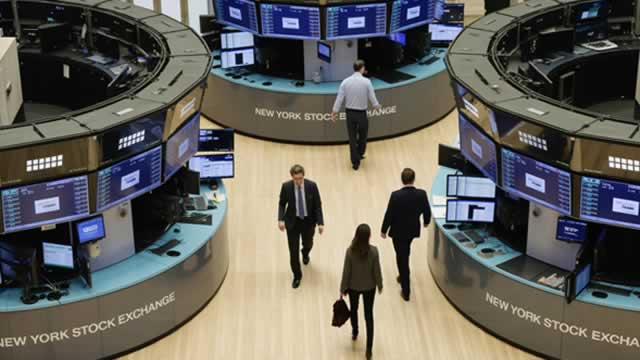
TCW global head of distribution Jennifer Grancio says it's a ‘really interesting time' in the active fixed income management space. She sits down with CNBC's Dominic Chu on “ETF Edge” to discuss the latest trends and flows she's seeing, including CLO ETFs.

The yield on the 10-year note finished July 31, 2026 at 4.75% while the 2-year note ended at 4.28%. The chart below overlays the daily performance of several Treasury bonds, starting from the pre-recession equity market peaks, along with the Federal Funds Rate (FFR) since 2007.