
Loading…
Loading…


Sell-side consensus EPS, revenue estimates, YoY growth, forward P/E, and per-year analyst coverage — for any covered stock.
Click below to see what's inside, then upgrade to unlock for this and 80,000+ other tickers.
See price against where its own fundamentals say it should trade — the shaded gap is the discount or premium, across five valuation lenses.
Click below to see what's inside, then upgrade to unlock for VOPKY and 80,000+ other tickers.
See exactly how VOPKY's revenue becomes profit — a Sankey that traces revenue (and its reported segments) through gross profit, operating expenses, and net profit, with the year-over-year change on every line.
The same diagram the Chart Builder draws, right on the Summary tab. Upgrade to unlock it for VOPKY and 80,000+ other tickers.
Koninklijke Vopak N.V. operates as an independent, global provider of tank storage solutions, specializing in the secure storage and efficient handling of a wide array of bulk liquids and gases. Its core services encompass liquid chemicals, liquefied natural gas (LNG) and other gases, refined petroleum products, biofuels, and various vegetable oils. To facilitate these operations, the company owns and manages a comprehensive network of specialized infrastructure, which includes large-scale storage tanks, marine jetties for vessel access, dedicated truck loading facilities, and extensive…

Koninklijke Vopak N.V. (VOPKY) Q1 2026 Earnings Call Transcript

Resolutions passed by Vopak's Annual General Meeting Rotterdam, the Netherlands, 22 April 2026 The Annual General Meeting of Koninklijke Vopak N.V. (Royal Vopak) held on 22 April 2026 passed the following resolutions:

The Netherlands, 22 April 2026 Vopak reports strong start of the year and confirms 2026 outlook Key highlights Q1 2026 Improve Net profit -including exceptional items- Q1 2026 of EUR 85 million and EPS of EUR 0.74 Proportional operating free cash flow in Q1 2026 of EUR 224 million leading to a proportional operating free cash flow per share of EUR 1.96 First quarter results were not materially impacted by the Middle East conflict Subject to ongoing market uncertainties and currency exchange movements, we confirm our outlook for 2026 First tranche of EUR 100 million, part of the multi-year share buyback program, was launched and 16% had been completed up to 17 April 2026 Grow The deployment of capital towards gas and industrial infrastructure is progressing well, in total EUR 1.1 billion growth commitments are under construction primarily in the Netherlands, India and Canada Accelerate In Q1 2026, we have taken a final investment decision to repurpose capacity at our Europoort terminal in the Netherlands for the storage of pyrolysis oil, strengthening and further integrating our industrial partnership in the terminal The deployment of capital towards energy transition infrastructure is progressing, in total EUR ~200 million growth commitments are under construction mainly located in Brazil and Malaysia In EUR millions Q1 2026 Q4 2025 Q1 2025 IFRS Measures -including exceptional items- Revenues 333.2 325.8 328.9 Net profit / (loss) attributable to holders of ordinary shares 85.1 197.5 99.8 Earnings per ordinary share (in EUR) 0.74 1.72 0.85 Cash flows from operating activities (gross) 195.6 213.1 305.9 Cash flows from investing activities (including derivatives) - 88.8 -153.6 -137.5 Alternative performance measures -excluding exceptional items- 1 Proportional revenues 479.1 467.0 488.4 Proportional group operating profit / (loss) before depreciation and amortization (EBITDA) 294.6 281.8 299.9 Proportional operating free cash flow 224.4 179.7 227.6 Net profit / (loss) attributable to holders of ordinary shares 92.1 108.0 97.8 Earnings per ordinary share (in EUR) 0.80 0.94 0.84 Business KPIs Storage capacity end of period (in million cbm) 35.6 35.5 35.6 Proportional storage capacity end of period (in million cbm) 20.5 20.4 20.4 Subsidiary occupancy rate 91% 91% 91% Proportional occupancy rate 91% 92% 92% Financial KPIs 1 Proportional operating cash return 16.6% 13.7% 16.8% Net interest-bearing debt 2,675.1 2,699.9 2,524.7 Total net debt : EBITDA 2.50 2.45 2.21 Proportional operating free cash flow per share (in EUR) 1.96 1.57 1.95 Proportional leverage 2.60 2.60 2.55 CEO message We had a strong start of the year, with occupancy rate at 91%. Building on our proven track record of strategic execution, we are well positioned to capture growth opportunities in gas and industrial infrastructure as well as infrastructure for the energy transition.
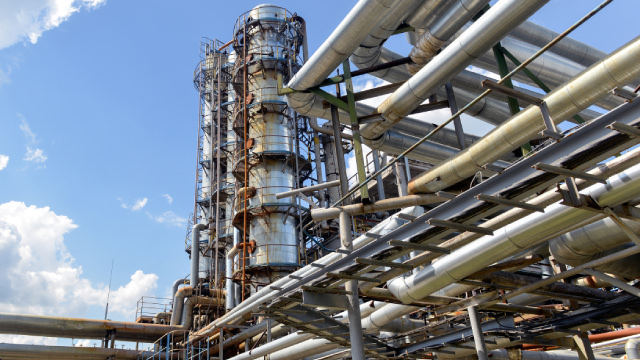
Dutch tank storage and terminal operator Vopak has pushed back a final investment decision (FID) on South Africa's first liquefied natural gas terminal to 2028, a senior executive said on Wednesday.
Noble (NYSE: NE - Get Free Report) and Royal Vopak (OTCMKTS:VOPKY - Get Free Report) are both mid-cap energy companies, but which is the superior investment? We will compare the two companies based on the strength of their analyst recommendations, profitability, risk, valuation, earnings, institutional ownership and dividends. Institutional and Insider Ownership 68.1% of Noble shares